
In cryptocurrency and other markets, fundamental analysis can answer the question of what to buy or sell – and technical analysis helps answer the question of when to buy or sell it. An essential component of technical analysis is the concept of support and resistance levels, which is frequently used in identifying high-probability setups.
Cryptocurrency is particularly prone to bouts of volatility, so traders should consider any tools at their disposal to make sense of seemingly unpredictable price paths. Whether you’re trading Bitcoin, altcoins, or just about any other asset, using support and resistance can level the playing field while removing unnecessary emotions from the process
Think of Floors and Ceilings
While the price of an asset at any given moment is known and mathematically precise, the concepts of support and resistance are somewhat “fuzzy” and subject to individual interpretation. In other words, support and resistance are part science and part art.
An easy way to conceptualize support is as an imaginary floor that the price of an asset has bounced off of. If the price is like a rubber ball, then a support level represents a theoretical floor which that ball has fallen to but then rebounded from at least once.
Similarly, if the asset’s price moved up to a price at least once but then fell back down – much like a ball bouncing off of a ceiling – then this could be considered a resistance level. Alternatively, you could imagine a group of buyers on the market’s trading floor providing “support” to an asset at a certain price, or a group of sellers putting up “resistance” at a certain (probably higher) price.
Drawing the Lines Takes Practice
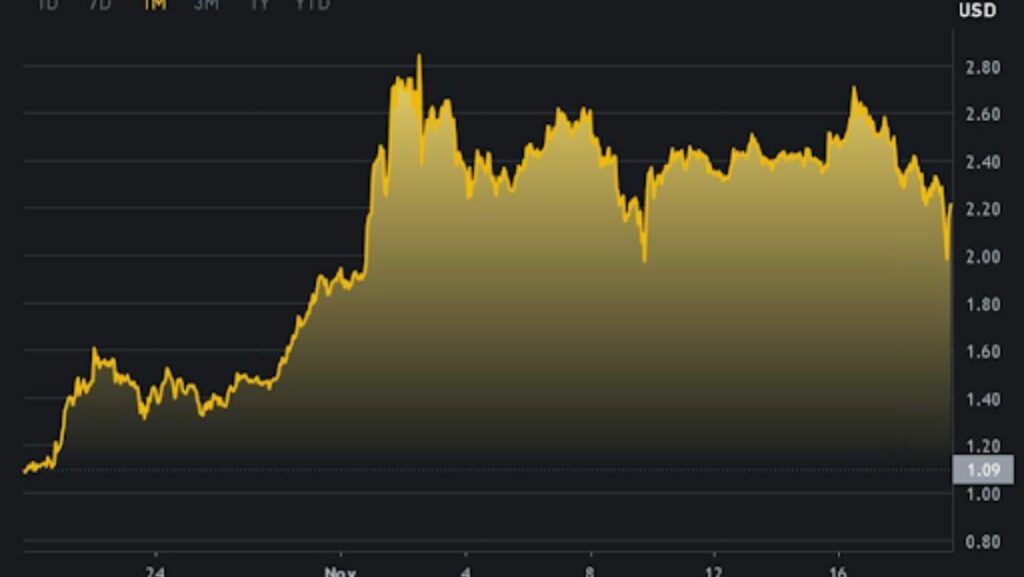
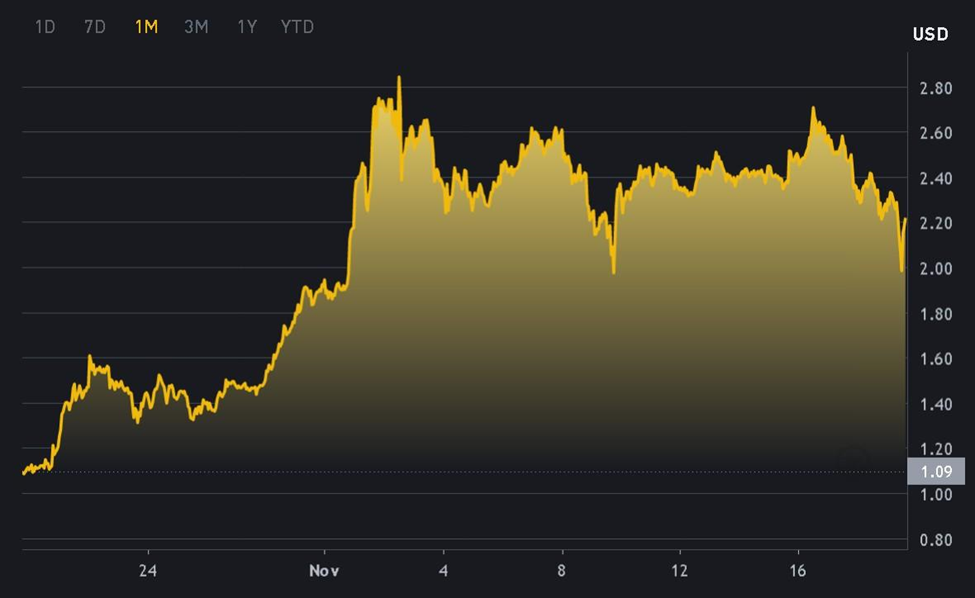
So, let’s say you’re trading XRP and you check the one-month chart. Technical traders will probably notice that Ripple bounced off of the $2 level a couple of times on December 10th and December 20, 2024, according to the Binance chart. Bear in mind, this isn’t an exact science and the Ripple price didn’t rebound exactly from $2, but fairly close to it.

In this case, finding a resistance level may be more challenging. Selling pressure seems to have come at around the $2.60, $2.70, and $2.80 levels, so different traders will interpret the resistance level in different ways. For the time being, we can just call $2.70 a resistance level for this Ripple chart.
Thus, we can draw a support line and a resistance line, which together are the parallel lines that form a channel:
It takes time and practice to master the art and science of drawing lines representing support and resistance levels. After a while, however, you should be able to identify these levels fairly quickly.
Putting Concepts into Practice
The theory behind these levels is that buyers have stepped in at the support level in the past, and they may do so again in the near future, so that’s a good place to buy the asset. Likewise, sellers have previously shown up at or near the resistance level, so that’s a reasonable place to take profits.
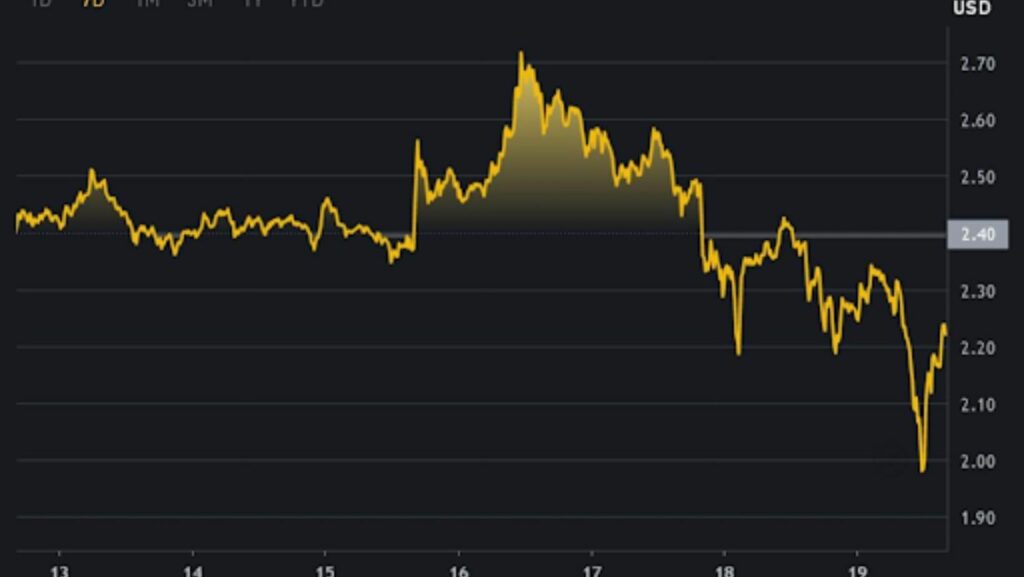
By the way, the lines and channels don’t always have to be horizontal. Take a look at this seven-day Ripple chart from Binance, and see if you can draw your own support and resistance lines:
It will be much easier to draw the lines if you don’t assume that they have to be perfectly horizontal. On the right side of the chart, you may detect that the buyers have stepped in at increasingly lower prices, while the sellers have also put up “resistance” at increasingly lower price points.
Knowing this, we can draw a diagonal, downward-trending channel:
Technical analysts might call this a series of “lower highs and lower lows,” meaning increasingly lower resistance and support levels. Most technicians would probably suggest that this is a “bearish” setup (meaning the Ripple price is likely to go lower) based on the sharply downward angle of the channel.
On the other hand, if the support and resistance lines (and therefore the channel) were trending upward, this could provide a “bullish” bias (meaning the asset’s price has the potential to head higher). In that case, optimistic traders might extend/extrapolate the lines and then buy the asset soon after it bounces off of the support line, if that occurs.
Even more important than practicing your line-drawing skills is to always use caution in your trades and don’t rely too much on any single technical signal. Support and resistance levels should be just one tool among many in your toolbox – but if applied properly, they can be highly useful indicators for technically minded cryptocurrency traders.